

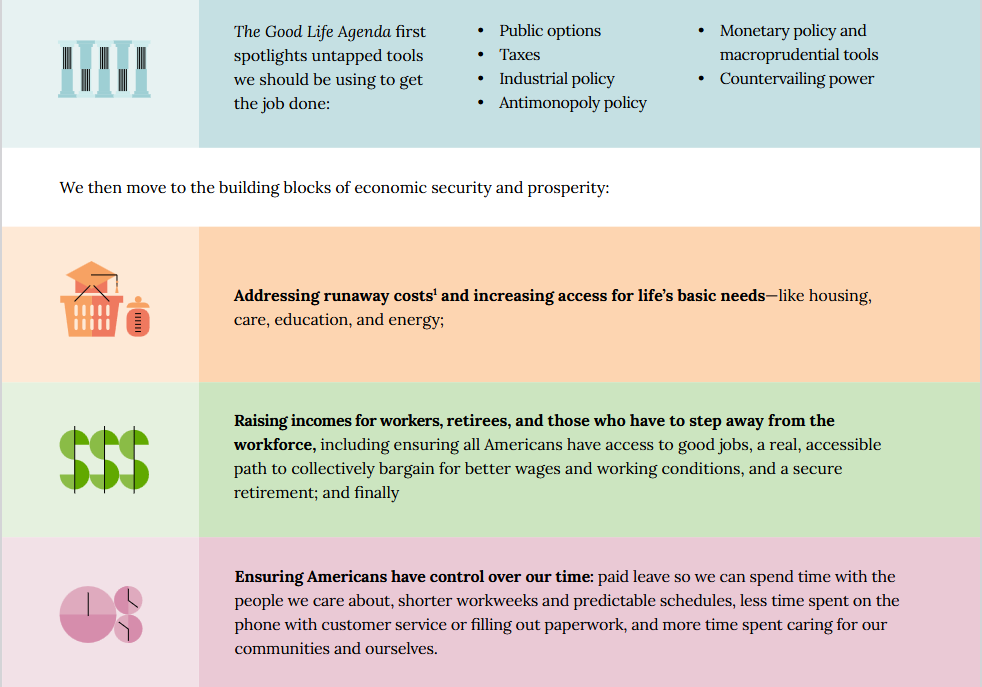
Above: Summary of the “Good Life Agenda.”
Author’s Note: Dan Rodrick’s column this morning brought to my attention the outstanding report about “ALICE: Asset Limited, Income Constrained, Employed,” Americans prepared by United4ALICE, a project launched by United Way of Northern New Jersey.[1] It follows on the heels of the recent release of another noteworthy report, The Good Life Agenda by the Roosevelt Institute.
With the state of the economy a top issue going into the November elections, I thought, therefore, that a deep dive into these major economic studies was imperative. [Be advised that related articles appear here on Information Bank discussing Affordability, Market Power, and Tax Reform (multi-part series).][2]
As you will quickly see, there is much that can/must be done to fix the economy so that it works for all Americans. The first task, however, must be for elected officials, candidates for office, and the media to start using the right measurements of economic conditions. [Note: I can’t figure out if they are intentionally avoiding using the correct measurements to frame the issue properly or if they simply have so little understanding of the basics of economics they don’t know how off base their discussions and solutions are.]
A. Overview
Fast Company, “Why Statistics Aren’t Reflecting the Economy and American Life,” (November 3, 2025).[3]
Below, Gene Ludwig shares five key insights from his new book, The Mismeasurement of America: How Outdated Government Statistics Mask the Economic Struggle of Everyday Americans.
Gene is the former Comptroller of the Currency and founder of the Ludwig Institute for Shared Economic Prosperity (LISEP), a nonprofit dedicated to uncovering the truths that official statistics too often obscure. His writing has appeared in The New York Times, The Wall Street Journal, The Atlantic, Politico, The Financial Times, and TIME.
Americans keep hearing that the economy is strong. Unemployment is low. Wages are rising. Growth is steady. But for millions of families, those headlines feel like a cruel joke. The cost of rent, groceries, and healthcare keep climbing while steady, well-paid work remains out of reach. The disconnect isn’t just perception—it’s baked into the way we measure economic success.
1. We Are At An Economic Tipping Point. Throughout history, when governments fail to fully appreciate the realities faced by their people, it leads to crisis. The United States may be on the brink of such economic and societal unrest. The unrest that led to the French Revolution and the economic imbalances preceding the Great Depression are both cases in point.
In the late eighteenth century, the oppressive economic situation facing the French people went unacknowledged by the royal family for decades. The French ruling class considered the truth about the nation’s fiscal crisis to be nefarious—a threat to their power. Marie Antoinette, when told the peasants had no bread, replied, “Let them eat cake!” Whether or not the remark is literal or legend, it captures the ruling class’s indifference. Soon after, the Revolution erupted, bringing turmoil and suffering to French citizens of every rank and station.
The same narrative arc applied a century and a half later when the Great Depression loomed. In both instances, economic data that could have set off alarm bells was available—more accurate figures that would have revealed the risks emerging—and this perspective might have prompted action that could have softened the blow, if not avoided the crises altogether. But the data was either confusing, confounded with other contrary data, or affirmatively hidden. The effects were catastrophic.
2. A Quarter of Americans Are Functionally Unemployed. The unemployment statistics our government releases monthly are misleading. If someone is looking for full-time employment but finds nothing except a single hour of work in a week, they are considered “employed” in the eyes of the government. For purposes of official government statistics, this one-hour employee is in the same category as someone secure in a full-time job.
This logic extends to wages. Someone who works full- or part-time for a salary that falls below the poverty line (around $25,000 a year for a three-person household) is classified the same way as someone earning $1 million every month.
LISEP’s research team and I consider anyone in the previous two situations to be functionally unemployed. The government’s most recent unemployment rate is 4.3 percent, but our research finds that 24.7 percent of American workers are functionally unemployed.
3. Pay Statistics Ignore Part-Time and Unemployed Job Seekers. The government reports on “median wages” every quarter. The idea behind their metric is simple and straightforward: If you line up all full-time employees in order of their weekly earnings, the person directly in the middle earns the median wage.
But this statistic only considers the wages of people who are currently employed full-time, overlooking millions of part-time workers and unemployed job seekers. So, the moment a low-wage factory worker receives a pink slip, her salary is deleted from the sample altogether. The moment a farm worker’s seasonal employment ends, his salary is similarly deleted.
What this means is the official earnings measure shows an overstated wage that doesn’t reflect the reality for many low- and middle-income Americans. It can even appear to improve during economic downturns because low-wage workers are disproportionately affected by layoffs. When the economy went into near freefall during the early months of the COVID-19 pandemic, government-reported median earnings rose seven percent. During that same period, the percentage of functionally unemployed Americans rose from 25.7 percent to 32.8 percent.
4. Yes, Your Groceries Are More Expensive. When people talk about inflation, they’re usually referring to changes in the Consumer Price Index, or CPI. The CPI tracks the prices of some 80,000 goods and services, from apples to apartments, baby formula to boats, and much more. The idea is that it gives us a single figure to measure the changing cost of a basket of all consumer products.
This basket is so wide-ranging that it doesn’t reflect how “ordinary” consumers experience cost-of-living changes, as most Americans are not buying 80,000 things. If the costs of second homes tripled while everything else in the basket stayed flat, the average American household wouldn’t feel a thing—the price hike would get averaged in, but it wouldn’t impact their life.
But the opposite is true. Over the past two decades, the price of jewelry has risen by about 39 percent, while essential goods like bread are up by 112 percent and ground beef by 155 percent. When these items are measured alongside each other in the CPI, the relative stability of luxury items masks the inflation faced by Americans of more modest means. From 2001 to 2023, the CPI points to a 72 percent rise in living costs, yet our analysis of essential expenses—housing,
food, transportation, healthcare, and other basics—shows those costs climbed 97 percent. CPI obscures the true cost of living for working-class Americans.5. We Need Better Statistics. The headline statistics we currently employ to understand America’s economy are profoundly misleading and, unfortunately, drive policy. The CPI is pivotal in determining Social Security Benefits, as well as who qualifies for the Supplemental Nutrition Assistance Program (SNAP), Head Start, and Pell Grants. At least twelve states and Washington, D.C., used the CPI to determine minimum wage.
Our failure to produce statistics that accurately reflect the nation’s economic reality makes it much harder to shape highly effective policy responses—and harder to identify the tipping point of economic and social unrest. Simply put, when you aim at the wrong target, you miss.
Flaws in widely accepted economic statistics impede important decision-making. In many cases, those who accept economic misrepresentations do so for benign reasons: The data is too difficult to collect with sufficient regularity or precision, or the samples aren’t sufficiently comprehensive. Human nature favors expeditious, rosy analysis rather than the rigor required to glean accuracy, particularly when accurate numbers may be gloomy.
At LISEP, we’ve developed alternatives to these imperfect statistics. Our True Rate of Unemployment (TRU) metric includes the functionally unemployed, and our True Weekly Earnings measure includes the entire workforce. Our True Living Cost (TLC) index narrows the basket of indexed consumer goods to those truly essential to the average American, while our Minimal Quality of Life (MQL) index measures what it costs to not just get by but to actually have an opportunity to climb the economic ladder. Finally, our Shared Economic Prosperity measure tracks how the country’s economic growth translates into opportunity for all.
For decades, policymakers and leaders have judged success or failure by distorted standards, and ordinary Americans have paid the price. Unless we change the headline statistics to reflect the reality Americans actually feel, we will keep steering down the wrong paths.
Ludwig Institute for Shared Economic Prosperity, “Beyond Survival, Analyzing the True Cost of Economic Well-Being. Minimal Quality of Life Index,” (May 2025).[4]
To accurately capture the cost of living and the resources required to achieve a minimal quality of life, the MQL considers a relevant basket of goods that reflect the day-to-day expenses necessary for low- and middle-income Americans to live decently and establish a foundation for future advancement.
…. Essential costs for a decent quality of life are rising quickly, forcing lower- and middle-income households to sacrifice important needs.
For example, housing and healthcare costs within the MQL have skyrocketed since 2001, rising by 130% and 178%, respectively. Even costs of essential technology, crucial for work, education, and communication, have risen by 132% since 2001, further burdening families (Figure 7). This squeeze
forces difficult choices: Essential costs for a decent quality of life are rising quickly, forcing lower- and middle-income households to sacrifice important needs.Sacrificing Healthcare Needs: Many families are forced to forgo necessary medical care due to cost, which could lead to more expensive issues down the line. The number of Americans delaying medical treatment hit a record high in 2022, with 38% of people reporting putting off medical care
because of cost.
Delaying Future Goals: More than half of adults (53%) have postponed major life goals due to economic challenges.
Shifting Living Arrangements: The rising cost of living has made it increasingly difficult for young adults to live independently and save money, contributing to the recent rise in young adults living with their parents. Since 1971, the percentage of 25–34-year-olds residing in multigenerational households has grown significantly, from 9% to 25% in 2021.
…. The MQL underscores the critical need to redefine economic well-being and how we think about inflation, shifting focus on metrics that better reflect the realities of low- and moderate-income households. It serves as a powerful call to action for policymakers and advocates to bridge the gap between the promise and reality of the American dream. By implementing policies and interventions that address the rising costs and stagnant wages, we can better ensure all Americans have a fair shot at a fulfilling and secure life.
Ludwig Institute for Shared Economic Prosperity, “Living on the Edge, Analyzing the True Cost of Living for Everyday Americans,” (June 4, 2024).[5]
________________________________________, “Measuring Better: Development of ‘True Rate of Unemployment Data As the Basis for Social and Economic Policy,” (November 19, 2020).[6]
________________________________________, “The Myth of the Rising Tide: A Deeper Dive Into Shared Economic Prosperity,” (May 2025).[7]
________________________________________, “True Living Cost (TLC), ” LISEP Cost-of-Living Metric.” [8]
To determine the TLC, LISEP tracks changes in prices for the essential items and services that individuals and families need to maintain a basic standard of living. These are the key differences in the methods used to calculate the Consumer Price Index (CPI) and TLC:
Medical Care. While the CPI’s medical care categories are weighted based on what households pay out of pocket, the price changes they track reflect the total payments made to healthcare providers rather than the actual expenses households face. Because of this, the CPI for medical care largely ignores health insurance premiums, which make up the majority of medical spending for most households. For the bottom 60% of American households, health insurance premiums account for more than 60% of all medical costs in 2024.
Housing. The CPI assigns less than 25% of housing costs to rent, effectively assuming that most Americans own their homes. But among the bottom 60% of U.S. households by income, only about half were homeowners in 2020. The issue goes further. The CPI’s housing measure’s weights are based largely on surveys in which homeowners estimate what they think their homes would rent for, not on actual market rents. By contrast, the TLC relies solely on real rental price data to reflect what households who rent are actually paying for housing.
Technology. CPI for technology does not account for the fact that technology has gone from being a luxury to a necessity. The CPI attempts to price, for example, the cost of checking email. But it doesn’t consider that Americans are now expected to be able to do this instantaneously, whereas this was not the case 20 years ago. This paradox is reflected in the fact that from 2007 to 2018, the newest iPhone release price went up 100% while the CPI for telephone hardware went down by more than 50%. The TLC index instead considers the minimal amount of technology that families need to function in society in any given year, and then prices this bundle throughout time.
Transportation. CPI for transportation accounts for all transportation-related goods, including boats, new cars, and airline fees, which are largely irrelevant to middle- and low-income families. The TLC Index takes into account the price of only the necessities, including gas, car ownership costs, and regular car maintenance.
The True Living Cost (TLC) is a cost-of-living metric that provides a more accurate picture of the economic reality for median- and lower-income (LMI) families.
When considering the most critical items the median earner needs to buy, buying power has decreased since 2001 by 5.5% (Median Earnings adjusted by TLC). The CPI, however, shows an increase in buying power for the median earner of 9.9%. Policymakers looking at CPI might believe that Americans are earning more and thus are able to purchase more necessities. But LISEP’s TLC Index shows the opposite is true: Americans are struggling more than ever as rising living costs have eaten away at earnings.
LISEP shows the percentage change in price over time for each category of minimal adequate needs faced by a median-income family of various household sizes. For instance, housing costs for a couple with three children have increased 134% between 2001 and 2024.
The TLC takes into account household size (the eight household sizes range from one to two adults and zero to three children) and census region (Northeast, Midwest, South, and West). The TLC tracks change in price for this minimal bundle over time.
As a comparison to the TLC, the CPI measures rising prices. The CPI better serves as an inflation metric rather than a cost-of-living metric due to the inclusion of luxury items and because it only includes the urban population, among other issues. Thus, the CPI distorts the reality of changing costs faced by most consumers. LISEP found that the CPI drastically understates changes in living costs for LMI families — the TLC rose nearly 1.4 times faster than the CPI since 2001: 106% vs. 77.2%.....
Why Does it Matter? Using the CPI as a cost-of-living metric has material implications for the well-being of American households.
Increases in pay, retirement, and Social Security are tied to the CPI. More than 15 federal assistance programs, such as the Child Tax Credit (CTC) and veterans’ pensions, are indexed to some iteration of the CPI in part or in full. This means that American households receive benefits that are not commensurate with the cost of living they face, and thus are worse off over time. This mismeasurement of the rising cost of basic needs poses a financial crisis for many families, making the American Dream further out of reach. Indexing government benefits and pay increases to the TLC would substantially correct for this mismeasurement and alleviate the financial burden of LMI families.
Rodricks, Dan, “Meet ALICE and the Actual Cost of Living. United Way Researchers Find a Lot More Financial Hardship Than SNAP-Cutting, Medicaid-Cutting Republicans Would Ever Acknowledge,” Dan Rodricks Commentary (June 16, 2026)[9]
Want a laugh? According to the U.S. Department of Health and Human Services, a family of four is considered poor if its 2026 income will be no more than $33,000. A single person is considered poor if her annual income will be $15,960 or less.
Howls of derisive laughter!
Please, try to compose yourself.
The Federal Poverty Level (FPL) has always been laughably low, but it’s no joke because it forms the baseline for eligibility for government benefits — Head Start, the Supplemental Nutrition Assistance Program (food stamps), the National School Lunch Program, the Low-Income Home Energy Assistance Program and the Children’s Health Insurance Program.
Over the years, Congress has made adjustments in maximum income levels to allow more people to be eligible for some government assistance, most notably the Medicaid expansion under the Affordable Care Act.
But anyone who lives in the real world — anyone who shops for food, pumps their own gas, pays for child care or tries to keep up with rent — would agree that the FPL, the starting point for the government’s accounting of poor households, is ridiculously low.
Addressing this reality gap, United Way undertook a national effort to come up with what you might call The Actual Cost of Living — a better understanding of where financial hardship really lives. And researchers found a lot more of it than SNAP-cutting, Medicaid-cutting Republicans would ever acknowledge.
For some 17 years, and in a growing number of states, United Way has been looking at the lives of the “working poor,” people who are employed, but who still do not earn enough to support their families. United Way calls such households ALICE households. That stands for “Asset Limited, Income Constrained, Employed.”
United Way data-divers consider the minimum costs of housing, child care, food, transportation, technology and health care in each state — down to the county level — to establish the “ALICE Household Survival Budget.” The costs are then compared to household incomes in each of 41 states and the District of Columbia.
United Way just updated its ALICE report with what it found in 2024, the latest year of study. The result was what you might expect: More than 41 percent of households were living below the ALICE threshold for their respective states.
North Dakota was best, with 31% below ALICE, while Louisiana was worst, with 49% in real hardship.
Democrats should be using ALICE data in messaging for the mid-term elections.
Some random findings from the updated report:
About 43% of households in Marquette County, Michigan did not bring in enough money to cover their basic needs.
In Sullivan County, Tennessee, nearly 40% of households were under the ALICE threshold.
In Mecklenburg County, North Carolina, 11% of households lived in poverty, but another 27%, or 129,135 households, fell under the ALICE threshold.
In Maryland, one of the wealthiest states in the nation, 39% of all households fell below the ALICE threshold. “In 2024, a family of four in Maryland needed $108,192 just to cover the essentials. Even with both parents working full time in two of the state’s most common jobs — a cook and a teller — a family’s combined income would fall short of the cost of basics by $33,063.”
A family of four must earn an average of $106,000 a year to afford basic needs across the greater Tampa Bay region, exceeding the average Florida survival budget of $91,000.
More than 40 percent of Oregon households face persistent financial hardship.
Between 2010 and 2024, the number of ALICE households grew by 23 percent, according to United Way.
Keep in mind: These findings are from the year Trump was re-elected. So the ALICE report does not reflect what Trump hath wrought since taking office again — his stupid tariffs and trade war; his stupid war with Iran and the ensuing escalation in the cost of energy. The year-over-year inflation rate hit 4.2 percent in May.
Meanwhile, Republicans continue to cut taxes for the rich and benefits for the working poor, the country’s ALICE households; the billionaire class continues to grow, and Elon Musk is supposedly the world’s first trillionaire; Trump obsesses about building a ballroom and an arch. Little wonder that so many people say they have lost faith in the nation’s promise and find it harder to achieve the American Dream now than a generation ago. It will take big, bold progressive leadership to pull us out of this ditch.
The following is a response from one of Dan’s readers:
Sandra: I am a single senior (69) living in Maryland. I work. I earn too little to stay afloat but way too much for any assistance. So far this year my earned income is just under $12,000 and I get Social Security of $1,282/month which pretty much only covers my lot rent (which goes up every year) and my Medicare premiums (which also go up every year).
I, like too many others, am not only living paycheck to paycheck but using credit cards which I can never pay off entirely. I took out grad loans to get a master’s degree in the hopes I’d get a better paying job in an emerging health field only to discover that employers want people already licensed in other health professions (as well as YOUNGER people, I don’t even get interviews).
I have had neighbors who died because they were rationing their meds, couldn’t afford dental care, couldn’t work. It would be nice to be able to move to a cheaper place but I don’t WANT to live in a seniors-only apartment (I love being around younger families) which would be way smaller than my single wide, darker (I have many large windows), and which require that I give up 2 of my 4 bonded cats who make life worth living.
TAX WEALTH, NOT WORK and let’s elect Democrats so we can start holding the Epstein Elites accountable for their crimes (one of which is making more people struggle).
Roosevelt Institute, “The Good Life Agenda,” (June 2, 2026).[10]
As our namesake FDR understood well, the goal of governing should be straightforward: make people’s lives better.
For many of our lifetimes, people haven’t been feeling that upward trajectory. Even as policymakers trumpeted ideas that were “good for the economy,” even in moments when top-line economic metrics were stronger than they are today, people have felt like they’re on unstable ground, unable to get a fair shake in life. Like others are getting ahead at their expense while they’re left behind.
That’s been true since the 1970s, and even more so in the 2020s. In 2024, America’s 1,135 billionaires had a net worth of about $5.7 trillion, almost 20 percent of US GDP that year. The high cost of living for life’s essentials, meanwhile, has reshaped this decade’s public debate. The issue was central to President Joe Biden’s unpopularity, has been a galvanizing theme of President Donald Trump’s rhetoric, and is a defining pillar in the policy agendas of recently elected officials like New York City Mayor Zohran Mamdani and New Jersey Governor Mikie Sherrill.
Any policymaker would be wise to heed this lesson: Americans expect a relentless focus on making their lives more affordable. But since 2022, we’ve also seen that a few years of wage growth and gradually improving inflation isn’t the recipe for a good life.
When you listen closely to working people’s stories—their stark and vivid descriptions of their problems, the dreams they defer or deem impossible—a bigger lesson emerges. Our vision can’t be about affordability alone, because people want so much more than to make ends meet.
People want to feel secure throughout their lives, whether they’re graduating into a job market transformed by AI or retiring during a recession. They want the ability to set down roots. To choose if and when they have children, and how many. To start the business they’ve always wanted. They want time to spend with their loved ones, to be able to step away and enjoy the fruits of their labor, care for a sick parent, or engage in service that brings meaning to their lives.
And they’re angry that these wants feel like a luxury or impossibility while they watch the rich get richer and more powerful—and pose increasing threats to the basic functioning of our economy and democracy. It’s reasonable to be angry that the administration’s response to the housing crisis is to ask us to draw down our retirement funds, or that Elon Musk is now approaching $1 trillion in net worth after gutting consumer protection and enforcement capacity during his brief stint in government. It’s egregious that, as working people struggle to afford life’s basics, President Trump himself “has profited from his return to the presidency by an amount of money equal to 16,822 times the median US household income,” as a New York Times editorial board review showed in January 2026.
If we want to build the will for a different world, we need to channel that frustration into a positive vision, and translate the aspirations people have for their lives into results they can feel.
That’s the point of The Good Life Agenda: to show what our economy and democracy could look like if all of us had access to the building blocks of economic security and prosperity, and how we can get there. How we can change the structures that prevent us from living the lives we want (and that allow ever-bigger and ever-less-accountable corporations to undermine our choices), and what it would look like if we did. How we can reset the relationship between democracy and markets and take the steering wheel when it comes to transformative forces like AI, so that policymaking reflects the will of the people—not a small group of tech executives and shareholders. What our democracy would look like if we took the keys back from the oligarchs and handed them to those who have long lacked a voice in policymaking, ensuring workers had real power in the economy.
We know well that the hollowed-out institutions of the early 2020s, let alone the ramshackle ones of the second Trump administration, won’t be up to the task.
United for Alice, “ALICE In Focus: Financial Hardship Among People With Disabilities,” (July 2022).[11]
United for Alice, “The State of ALICE (Asset Limited, Income Constrained, Employed) in the United States. 2026 Update on Financial Hardship (2026).”[12]
In 2024, based on the Federal Poverty Level (FPL), 12.5% of U.S. households were defined as being in poverty. Yet this measure does not account for an additional 28.8% of the nation’s households — more than twice as many — that were also In financial hardship. These households are ALICE: Asset Limited, Income Constrained, Employed — earning above the FPL, but not enough to afford basic expenses in the county where they live.
Combining ALICE households with those living in poverty, an estimated 41.3% of households in the U.S. were below the ALICE Threshold in 2024. The rate ranged across states, with a low of 31% in North Dakota and a high of 49% in Louisiana.
The U.S. economy relies on ALICE workers to run smoothly, and ALICE households are an integral part of our communities in all aspects: civic, social, cultural, religious, and recreational. Yet ALICE workers struggle to support their own families. They are forced to make impossible choices, like deciding whether to pay for utilities or a tank of gas, whether to buy food or fill a prescription; whether to live close to work and pay more for housing or opt for a longer, less convenient commute with higher transportation costs. And they are less likely to have the resources to cover unexpected household expenses (like an unforeseen car repair or a costly medical bill), or to recover from crises, both widespread (like a natural disaster or public health emergency) and personal (like the loss of a job or family member).
…. Between 2010 and 2024, the number of ALICE households in the U.S. increased by 23%, while the total number of households increased by 15%. In comparison, the number of households in poverty increased by only 3%. The core issue is the gap between household income and what families actually need to make ends meet. This makes it impossible for many household to attain financial stability, no matter how hard they work.
There is no single cause — or solution — because all ALICE households are different and the reasons that households face hardship are complex and interrelated. Targeted interventions can temporarily help ease immediate challenges like food insecurity or housing cost burden, but improving overall financial stability for the long term requires more comprehensive strategies. Coordinated action is needed across multiple levels — including household supports, community infrastructure, employer practices, and public policy — to address the upstream conditions that contribute to persistent hardship for ALICE households across the nation.
Getting an Accurate Count: The ALICE Measures
The Federal Poverty Level (FPL) is obsolete. It does not consider the wide variation in cost of living by location across the U.S. (except for a slightly higher state-level FPL for Alaska and Hawaii), nor has its methodology been updated since it was formulated in the 1960s, despite changing economic conditions.
As a result, the official poverty rate sharply underestimates the true extent of financial hardship in the U.S. And because the FPL, or multiples of the FPL, define eligibility for many types of public assistance, ALICE households — 28.8% of all households nationwide — often do not qualify. In 2024, the FPL in the contiguous U.S. was $15,060 for a single adult and $31,200 for a family of four.
The ALICE measures, developed by United For ALICE, present a more comprehensive picture of financial hardship by including ALICE households — those with income above the FPL, but below the cost of basics — ensuring that no struggling households go uncounted.
The two pillars of the ALICE measures are household costs and income. The ALICE Household Survival Budget estimates the cost of household basics — housing, child care, food, transportation, health care, and technology, plus taxes — for each county in the U.S., derived from a range of publicly available data sources. This is a minimal budget, with no room for emergency expenses, debt payments, or saving for the future. Change over time in the cost of household basics is tracked in the ALICE Essentials Index.
…. Work Arrangements: The ongoing shift to more precarious work arrangements impacts workers across the U.S. In 2024, of workers, only 41% had the security of a salaried full-time job (35+ hours per week, for 50+ weeks). The rest relied on non-standard work arrangements — typically hourly paid work from one or multiple jobs (including part-time and gig work). Hourly and part-time workers are more likely to have fluctuations in income due to schedule changes and variable hours, and they are less likely to receive benefits, such as health insurance, paid time off, family leave, or retirement plans.
Both systemic and personal factors can contribute to this. Many workers want to work full-time but struggle to find and secure full-time employment. Others work part time because their hours have been reduced. Still others are unable to work full time due to family responsibilities, being in school or training, or dealing with illness or disability. In the U.S. in 2024, of people in the labor force, 26% worked part time. Part-time workers were much more likely to be below the ALICE Threshold than full-time workers (41% vs. 19%).
There were also 36% of people in the U.S. who were out of the labor force (not working or looking for work in the past four weeks). This included those who were retired (18%) and those who were out of the labor force for other reasons, such as disability, health issues, caregiving responsibilities, or student status (18%).
B. Additional Resources
Gates Foundation, “Economic Mobility and Opportunity.”[13]
Urban Institute, “Upward Mobility Institute.”[14]
Washington Center for Equitable Growth, “Factsheet: U.S. Economic Mobility and Policies to Increase Upward Mobility,” (June 17, 2025).[15]
P.S. As usual, the full article with all footnotes and graphics is contained in the attached PDF.